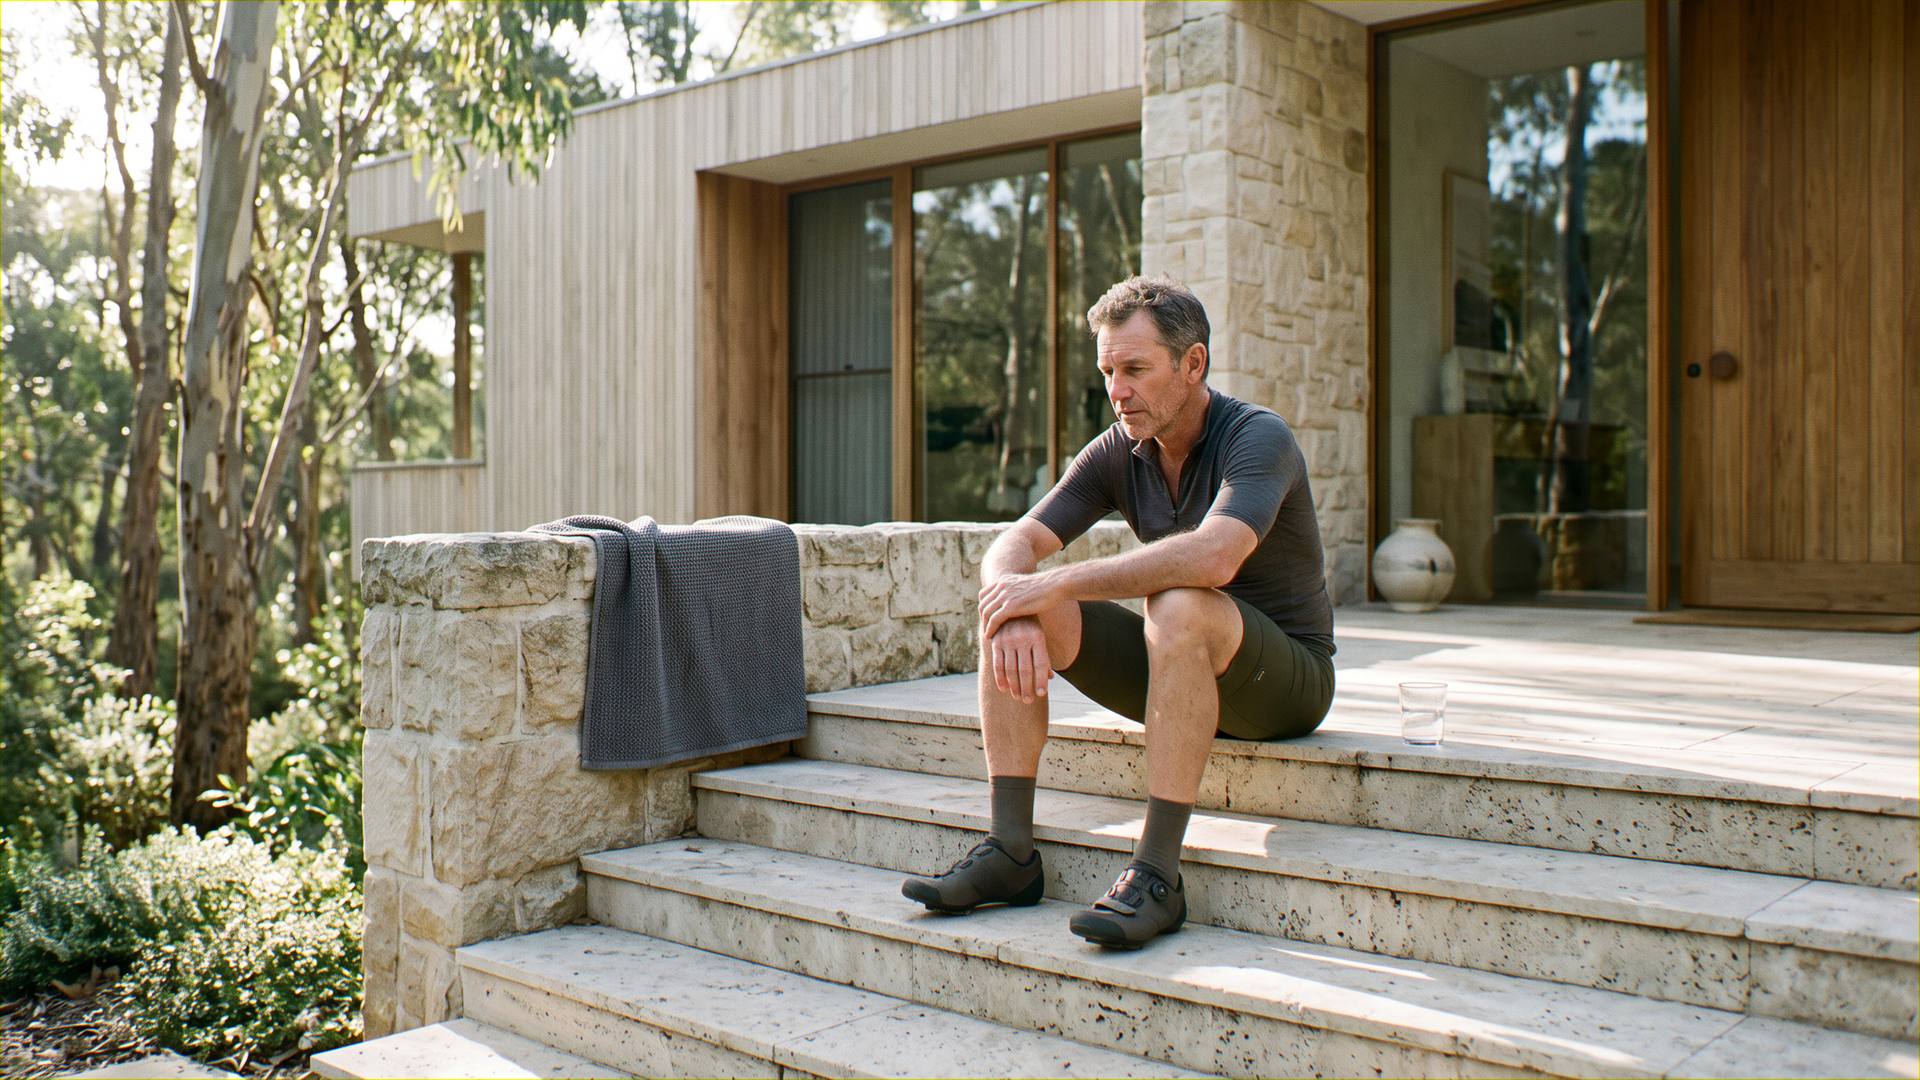
Why recovery takes longer than it used to.
The same training week, the same run of short nights, and it now costs three days instead of one. That gap has a rate attached to it, and the rate is measurable.
Recovery slows with age because several systems shift at the same time. Slow-wave sleep declines, muscle requires a larger stimulus to produce the same adaptation, aerobic capacity falls by roughly 10% per decade, and background inflammation rises. Each change is modest on its own. Together they mean the same week of load takes longer to clear than it did ten years ago.
The measurement worth having is not a biological age number. It is pace of ageing: how many biological years you are accruing per calendar year, right now. Unlike an accumulated-age estimate, pace has been shown to respond to intervention inside a randomised controlled trial, which makes it a target rather than a verdict.
Slower recovery is not one system failing. Sleep architecture, muscle responsiveness, aerobic capacity and inflammatory tone all shift with age, and they compound.
Across adulthood the proportion of slow-wave sleep and total sleep time both decline, while time spent awake after falling asleep increases.
Older muscle still adapts as well as younger muscle, but only once exercise volume and protein dose pass a higher threshold.
Pace of ageing measures rate, not state: biological years accrued per calendar year. A result of 1.0 means one biological year per calendar year.
In a two-year randomised trial, caloric restriction slowed pace of ageing while leaving biological age clocks unchanged. The effect size was small.
Recovery is not one system.
The complaint is specific and it is consistent. A hard training week used to cost a day. Now it costs three. A late flight and two short nights used to be absorbed without comment, and now they show up in mood and output for most of the following week. Most people file this under getting older and stop there.
What has changed is rarely one thing getting worse. It is four things moving at once, each of them modest, all of them pointing the same way.
Sleep is the first. Across adulthood, the proportion of slow-wave sleep falls, total sleep time shortens, and time spent awake after falling asleep rises.1 Slow-wave sleep is the phase most associated with physical restoration. You can spend the same eight hours in bed at 48 that you did at 35 and get materially less of the sleep that does the repairing. This is the part people most often mistake for a discipline problem, and it is covered in more detail in our piece on the sleep you are not measuring.
Muscle is the second, and it is more forgiving than most people assume. Older muscle still responds to training and to protein. A systematic review comparing young and older adults found the response becomes equivalent once exercise volume and protein dose, including its leucine content, pass a higher threshold. Below that threshold, age-related anabolic resistance becomes apparent.2 So the session that used to produce adaptation can now produce mostly damage, for no other reason than that it sits under a bar that has quietly moved.
Then aerobic capacity. In a longitudinal study of relatively fit older adults measured four times across six years, it declined by around 18% per decade in women and 24% in men. Once lung function and maximum exercise heart rate were accounted for, the decline sat near 10% per decade in both sexes.3 A given effort therefore sits closer to your ceiling each year, which means it costs more to produce and more to clear afterwards.
Inflammation is the fourth, and the one that quietly links the other three. Background inflammatory tone tends to rise with age, and is pushed higher by physical inactivity, poor diet, disrupted sleep and sustained psychological load.4 Inflammation is part of how tissue repairs itself. Chronically elevated, it is also part of why repair stalls.
None of these is dramatic in isolation. Together they explain the thing people actually notice, which is that the input has stayed the same and the bill has gone up.
You have not become less disciplined. The same week now draws on four systems that have all moved in the same direction.
Why a biological age number misses the point.
Most consumer testing answers a different question from the one worth asking. It returns a biological age: a single number, benchmarked against your birth date. It is memorable and it makes a good headline. It is also a snapshot of where you have arrived, and it says very little about how fast you are still moving.
The more useful quantity is rate. The Dunedin study followed a single birth-year cohort and tracked 19 indicators of organ-system integrity across four time points spanning two decades, which allowed researchers to model how quickly each person was actually ageing rather than simply where they had got to. That work produced DunedinPACE, a blood-based measure expressed as biological years accrued per calendar year.5 A result of 1.0 means you are ageing at one year per year. Above 1.0 means faster.
The distinction matters clinically. A biological age sitting two years above your chronological age describes accumulated history you cannot undo. A pace of 1.2 describes what is happening now, which is the only part still open to change.
This is not a novelty metric. In the same research programme, a faster pace was associated with morbidity, disability and mortality, and added predictive information beyond the established GrimAge clock.5
The pace of ageing can be changed.
This is the finding that turns the measurement into something worth acting on. CALERIE was a randomised controlled trial in which 220 adults without obesity were assigned to either 25% caloric restriction or an unrestricted diet for two years. A post hoc analysis of the trial’s blood samples, meaning one run after the fact rather than the question the trial was built to answer, found that the restricted group showed a slowed pace of ageing on DunedinPACE.6
Two details deserve attention, and an honest reading needs both.
First, the same intervention did not significantly shift the biological age clocks at all. PhenoAge and GrimAge were unmoved. The rate changed; the accumulated-state measures did not.6 That is a direct argument for measuring rate rather than state, and it came from inside a randomised trial rather than from an observational association.
Second, the effect size was small, and the authors say so plainly. A small change to a rate is not a small thing once it compounds across a decade, but this is not a result that supports dramatic claims and I am not going to make one. What it establishes is the part that matters: pace of ageing is not fixed. It moved in response to an intervention.
You do not age at one rate.
The other reason a single number underserves you is that your systems are not travelling together. Using plasma proteins that originate in specific tissues, researchers estimated the age of 11 major organs in 5,676 adults across five independent cohorts. Close to 20% of people showed strongly accelerated ageing in one organ, while only 1.7% were ageing quickly across several at once.7
The consequences were organ-specific. Accelerated organ ageing carried a 20 to 50% higher mortality risk overall, and accelerated heart ageing was associated with a 250% increase in heart failure risk.7
A 20-year follow-up of 6,235 middle-aged adults in the Whitehall II cohort found the pattern held prospectively. Larger organ age gaps predicted increased risk across 30 diseases, with several conditions tied specifically to accelerated ageing in their own organ.8
For someone whose actual complaint is that recovery has slowed, this is the practical part. “You are ageing faster than you should be” is not an answer anyone can act on. Which system, and how fast, is. Autonomic recovery is one of the more accessible entry points here, and we cover its measurement in stress resilience is trainable.
The four systems behind a longer bill.
Each shift is modest in isolation. The reason recovery feels different is that they are concurrent, and the same week now draws on all four.
| System | What changes | What that feels like in a normal week |
|---|---|---|
| Slow-wave sleep | Declines with age | A full eight hours in bed, and still waking unrestored |
| Muscle response | Higher stimulus threshold | Same session, more soreness, slower to repeat it |
| Aerobic capacity | Around 10% per decade | Efforts that were comfortable now sit near the ceiling |
| Inflammatory tone | Rises and persists | A heaviness that a single rest day does not clear |
| Pace of ageing | Varies person to person | Why two people the same age recover differently |
The rate is still yours →
A biological age result describes where you have got to. Pace of ageing describes how fast you are still travelling.
What these tests cannot tell you.
This field is oversold, and the distance between what the research supports and what the marketing implies is wide enough to be worth naming directly.
Epigenetic results carry real technical variability. When researchers ran the same sample twice through six widely used epigenetic clocks, technical noise on its own produced deviations of up to nine years between replicates.9 Nine years. A single consumer biological-age result, read as a precise fact about you, can be substantially an artefact of the assay rather than a statement about your biology.
There are two reasonable responses to that, and we use both. Choose measures built for reliability: the DunedinPACE work deliberately excluded low-reliability probes,5 and principal-component versions of the older clocks now agree between replicates to within about 1.5 years.9 Then read any single result as a starting position rather than a verdict, because the trajectory across repeat testing carries the signal that one reading cannot.
The population-level associations are also not individual predictions. A faster pace is associated with worse outcomes across large cohorts. It does not tell any one person what will happen to them, and anyone presenting it that way has gone past the evidence.
What the data actually says.
Slower recovery reflects concurrent change across sleep architecture, muscle responsiveness, aerobic capacity and inflammatory tone, rather than a single failing system.
Across adulthood, the proportion of slow-wave sleep and total sleep time both decline, while time awake after sleep onset increases.
Older muscle achieves a protein synthetic response comparable to younger muscle, but only above a higher threshold of exercise volume and protein or leucine dose.
Pace of ageing measures biological years accrued per calendar year, which is a different quantity from a biological age estimate.
In the CALERIE randomised trial, two years of caloric restriction slowed pace of ageing measured by DunedinPACE, with a small effect size, while biological age clocks were unchanged.
Around 20% of adults show strongly accelerated ageing in a single organ, and accelerated organ ageing carries a 20 to 50% higher mortality risk.
Technical noise alone can produce deviations of up to nine years between replicate runs of prominent epigenetic clocks, so a single result should be read as a starting position.
Frequently asked.
Is slower recovery just a normal part of getting older?
Partly. Some decline in sleep architecture, muscle responsiveness and aerobic capacity is expected with age. What varies considerably between people is the rate at which it happens. Two people of the same age can be accruing biological ageing at noticeably different speeds, and that rate can be measured.
What is the difference between biological age and pace of ageing?
Biological age estimates where your biology has arrived relative to your chronological age. Pace of ageing estimates how quickly you are accruing further change, expressed as biological years per calendar year. Biological age describes accumulated history; pace describes the current rate, which is the part still open to influence.
How accurate is a consumer biological age test?
Less precise than the marketing suggests. Technical noise alone has produced deviations of up to nine years between repeat runs of the same sample across six prominent epigenetic clocks. Measures designed specifically for reliability perform considerably better, and repeat testing over time carries far more signal than any single result.
Can pace of ageing actually be slowed?
There is randomised trial evidence that it can. In the CALERIE trial, two years of caloric restriction slowed pace of ageing as measured by DunedinPACE, though the effect size was small and the biological age clocks did not move. The finding establishes that the rate is modifiable rather than fixed.
Does every organ age at the same speed?
No. Plasma proteomic work across 5,676 adults found close to 20% of people show strongly accelerated ageing in one specific organ, while only 1.7% age quickly across several at once. This is why a single whole-body number can obscure the system that is actually driving your symptoms.
Measure the rate, not the number.
A structured protocol built on comprehensive testing, then measured year on year. Telehealth, Australia-wide.
Book a discovery callReferences.
- Ohayon MM, Carskadon MA, Guilleminault C, Vitiello MV. Meta-analysis of quantitative sleep parameters from childhood to old age in healthy individuals: developing normative sleep values across the human lifespan. Sleep. 2004;27(7):1255–73. doi.org/10.1093/sleep/27.7.1255
- Shad BJ, Thompson JL, Breen L. Does the muscle protein synthetic response to exercise and amino acid-based nutrition diminish with advancing age? A systematic review. American Journal of Physiology: Endocrinology and Metabolism. 2016;311(5):E803–E817. doi.org/10.1152/ajpendo.00213.2016
- Hollenberg M, Yang J, Haight TJ, Tager IB. Longitudinal changes in aerobic capacity: implications for concepts of aging. The Journals of Gerontology Series A: Biological Sciences and Medical Sciences. 2006;61(8):851–8. doi.org/10.1093/gerona/61.8.851
- Furman D, Campisi J, Verdin E, et al. Chronic inflammation in the etiology of disease across the life span. Nature Medicine. 2019;25(12):1822–1832. doi.org/10.1038/s41591-019-0675-0
- Belsky DW, Caspi A, Corcoran DL, et al. DunedinPACE, a DNA methylation biomarker of the pace of aging. eLife. 2022;11:e73420. doi.org/10.7554/eLife.73420
- Waziry R, Ryan CP, Corcoran DL, et al. Effect of long-term caloric restriction on DNA methylation measures of biological aging in healthy adults from the CALERIE trial. Nature Aging. 2023;3(3):248–257. doi.org/10.1038/s43587-022-00357-y
- Oh HS, Rutledge J, Nachun D, et al. Organ aging signatures in the plasma proteome track health and disease. Nature. 2023;624(7990):164–172. doi.org/10.1038/s41586-023-06802-1
- Kivimäki M, Frank P, Pentti J, et al. Proteomic organ-specific ageing signatures and 20-year risk of age-related diseases: the Whitehall II observational cohort study. The Lancet Digital Health. 2025;7(3):e195–e204. doi.org/10.1016/j.landig.2025.01.006
- Higgins-Chen AT, Thrush KL, Wang Y, et al. A computational solution for bolstering reliability of epigenetic clocks: implications for clinical trials and longitudinal tracking. Nature Aging. 2022;2(7):644–661. doi.org/10.1038/s43587-022-00248-2